Hazard
A climate-related event or process with the potential to cause harm.

Navigating Hazard, Exposure, and Vulnerability for Localized Resilience.
ClimEmpower climate risk methodology for Drought, Heatwaves, Wildfires and Floods, with documented variables, asset-specific approaches and final computation.
The ClimEmpower risk assessment workflow treats Hazard (H), Exposure (E) and Vulnerability (V) as distinct components. After the input variables are processed on a common scale, the final risk score is calculated as R = H × E × V.
A climate-related event or process with the potential to cause harm.
The presence of people, assets or ecosystems in areas affected by the hazard.
The susceptibility of exposed elements to suffer harm or loss.
The H, E and V component values are multiplied. The resulting map is then normalized against the maximum calculated risk within each region.
Where several variables make up one component, the ClimEmpower Risk Methodology aggregates them using equal weighting. For three variables, each contributes 0.33; for two variables, each contributes 0.5.
Convert variables to a comparable scoring scale where required and document whether higher or lower raw values represent higher risk.
Aggregate the variables belonging to the same component using equal weighting, while keeping the hazard- and asset-specific risk profiles shown on each hazard page.
The resulting risk values are used for region-specific normalization and qualitative classification.
Both approaches support climate-risk understanding, but they are designed for different purposes. The common ClimEmpower method is broader and highly replicable across the five case-study regions. The Andalusian method is more locally tailored and supports detailed flood mapping for Costa del Sol.
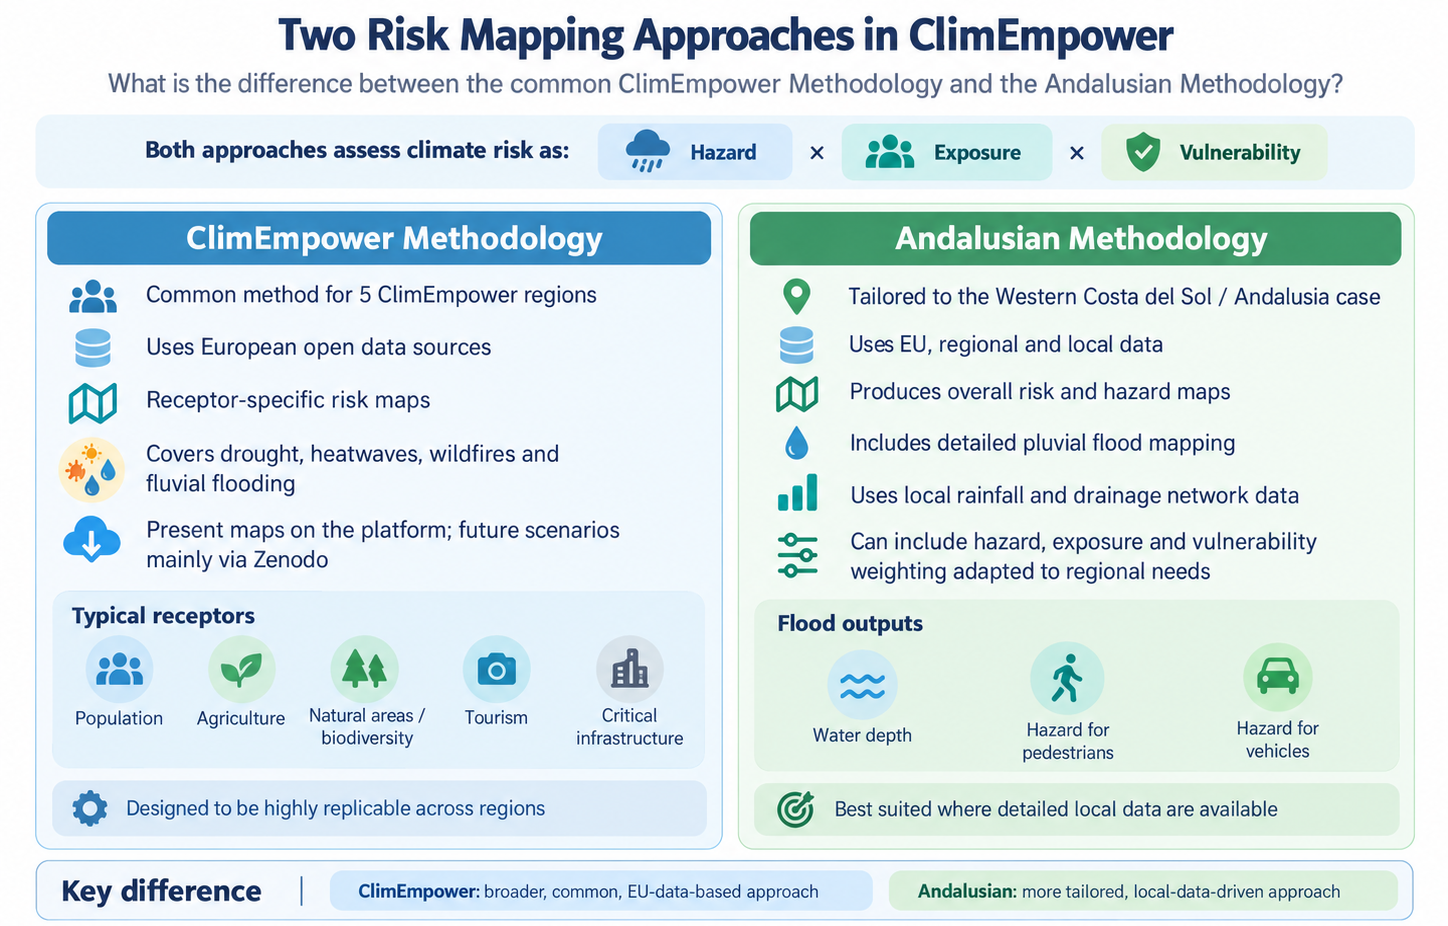
For full flood-specific outputs and direct record access, go to the flood methodology and the Methods, Data & Downloads section.
The ClimEmpower Risk Maps cover hazard- and asset-specific risk profiles. Drought, Heatwaves and Wildfires use the documented H × E × V scoring methodology; Floods use the supported flood-specific, asset- and scenario-specific workflow.
Use the direct links below for verified records and key project resources. Platform maps and downloadable Zenodo datasets are not always the same, so each card states what is currently confirmed.
Browse published ClimEmpower methods, maps and related datasets in one place.
Open the ClimEmpower Zenodo community ↗Present-condition river-flood hazard and direct-damage outputs for 10-, 100- and 500-year return periods.
Open river-flood methodology and maps ↗Present and future flood-depth and pedestrian/vehicle hazard maps for T10, T100 and T500 rainfall events.
Open Costa del Sol pluvial flood maps ↗The resilience factsheets link comes from the AIT presentation. Project reports and deliverables can also be accessed online.
Open resilience indicator factsheets ↗ Browse project deliverables ↗Important: the presentations mention additional drought, heatwave and wildfire products, but separate verified record links for those hazards were not independently confirmed here. Use the community page to check the current publication status.
The final ClimEmpower Risk Methodology uses SPI-6 as the drought hazard variable. Population and Agriculture are assessed as separate risk profiles; exposure and vulnerability variables are combined within each component using equal weighting.
The final ClimEmpower Risk Methodology represents heat hazard with tropical nights: daily minimum near-surface air temperature above 20°C. Exposure maps the presence of population and social facilities/basic services; vulnerability combines age distribution, proximity to green and blue cooling areas, population density and social-facility importance.
Wildfire hazard combines the Seasonal Fire Weather Index and Burnable Vegetation. Burnable Vegetation is explicitly treated as a hazard variable. Risk is differentiated for Population, Ecosystems/Biodiversity, Infrastructure, Tourism and Agriculture.
The Fluvial Flood chapter follows the tested CLIMAAX river-flood risk workflow adapted for ClimEmpower: present-condition JRC/CEMS flood-depth maps are combined with LUISA 2018 land use, JRC depth-damage curves and GDP-scaled maximum damage values using DamageScanner. Outputs are direct economic damage GeoTIFFs in EUR per raster cell for RP10, RP100 and RP500 (RP250 only if RP500 is unavailable).
Risk maps identify potential impacts, while resilience indicators and adaptation measures help assess preparedness and response capacities. Measures may lower exposure or vulnerability, but their effect should be evaluated rather than assumed.
ClimEmpower identified measurable indicators across health and wellbeing; population, society and education; economy and labour market; infrastructure; governance, strategy and planning; and environment and settlement areas. Indicators can help identify regional strengths and weaknesses, track changes over time and inform adaptation decisions.
Indicator selection considered relevance to urban, rural and agricultural regions, stakeholder priorities and data availability. Some useful indicators cannot currently be calculated consistently because the required data are missing or insufficiently detailed. Comparisons therefore depend on indicator definitions, spatial resolution and data quality.
Resilience indicator factsheets – Zenodo reference supplied by the AIT presentation ↗ (Publication metadata not independently verified.) Project deliverables D2.1–D2.4 ↗

Open the standalone References page for the academic and institutional sources underlying the ClimEmpower risk map methodology, hazard science and adaptation evidence base.